
Restaurant reviews - Overview
Restaurant reviews - Overview
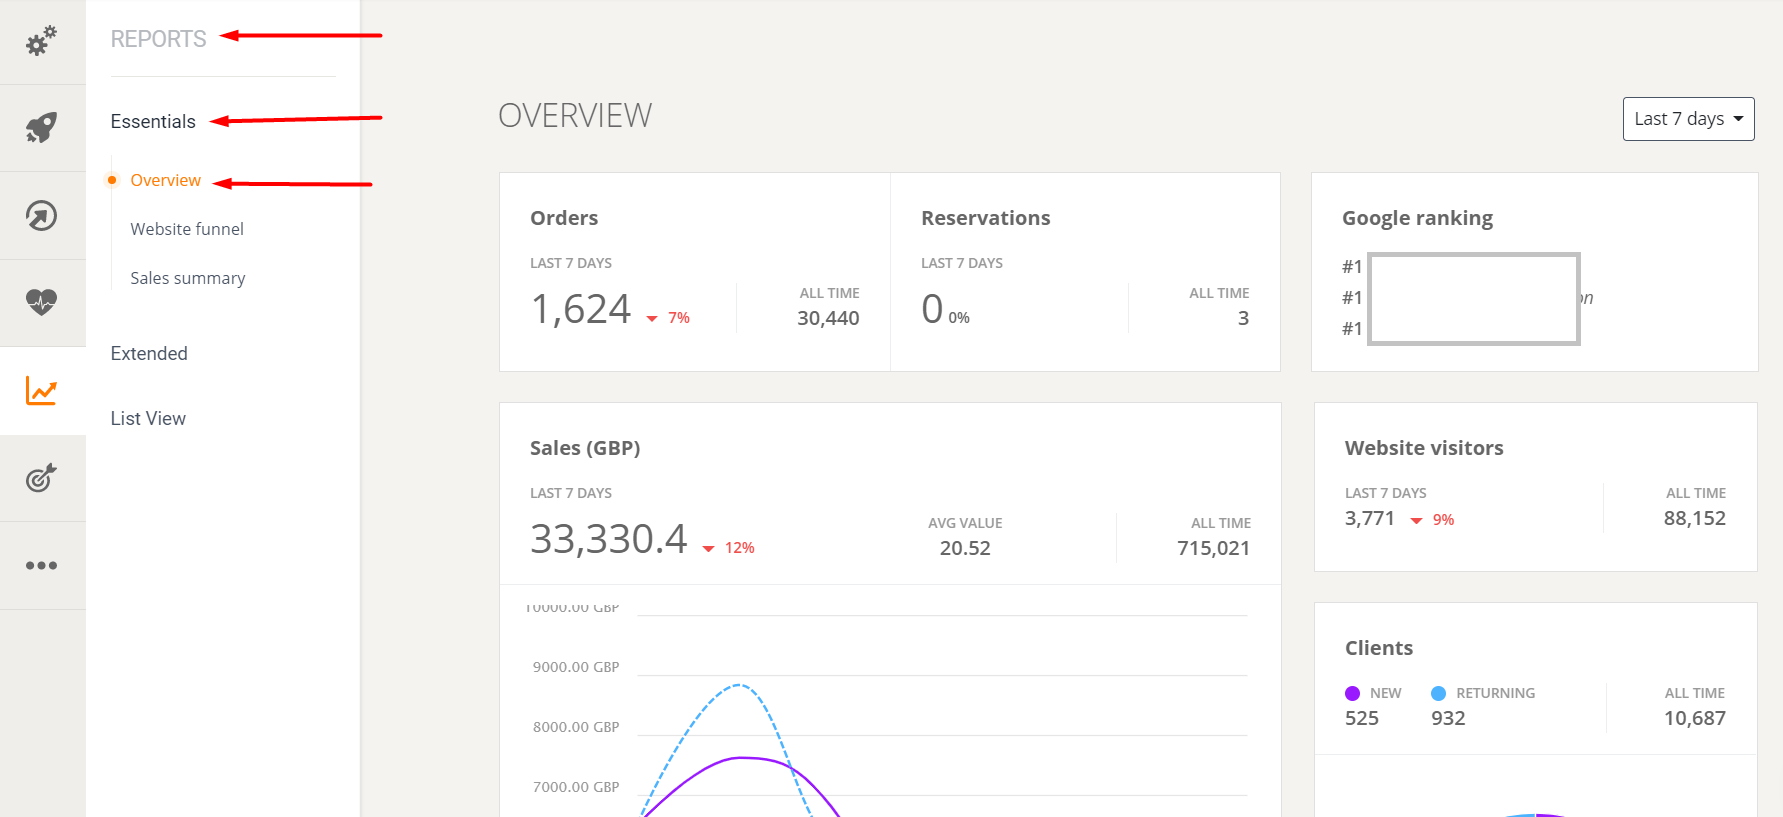
The admin dashboard allows the restaurant to track its success by viewing and exporting restaurant reports from the reporting module. There, they will also find recommendations on how to increase online orders and sales.
overview
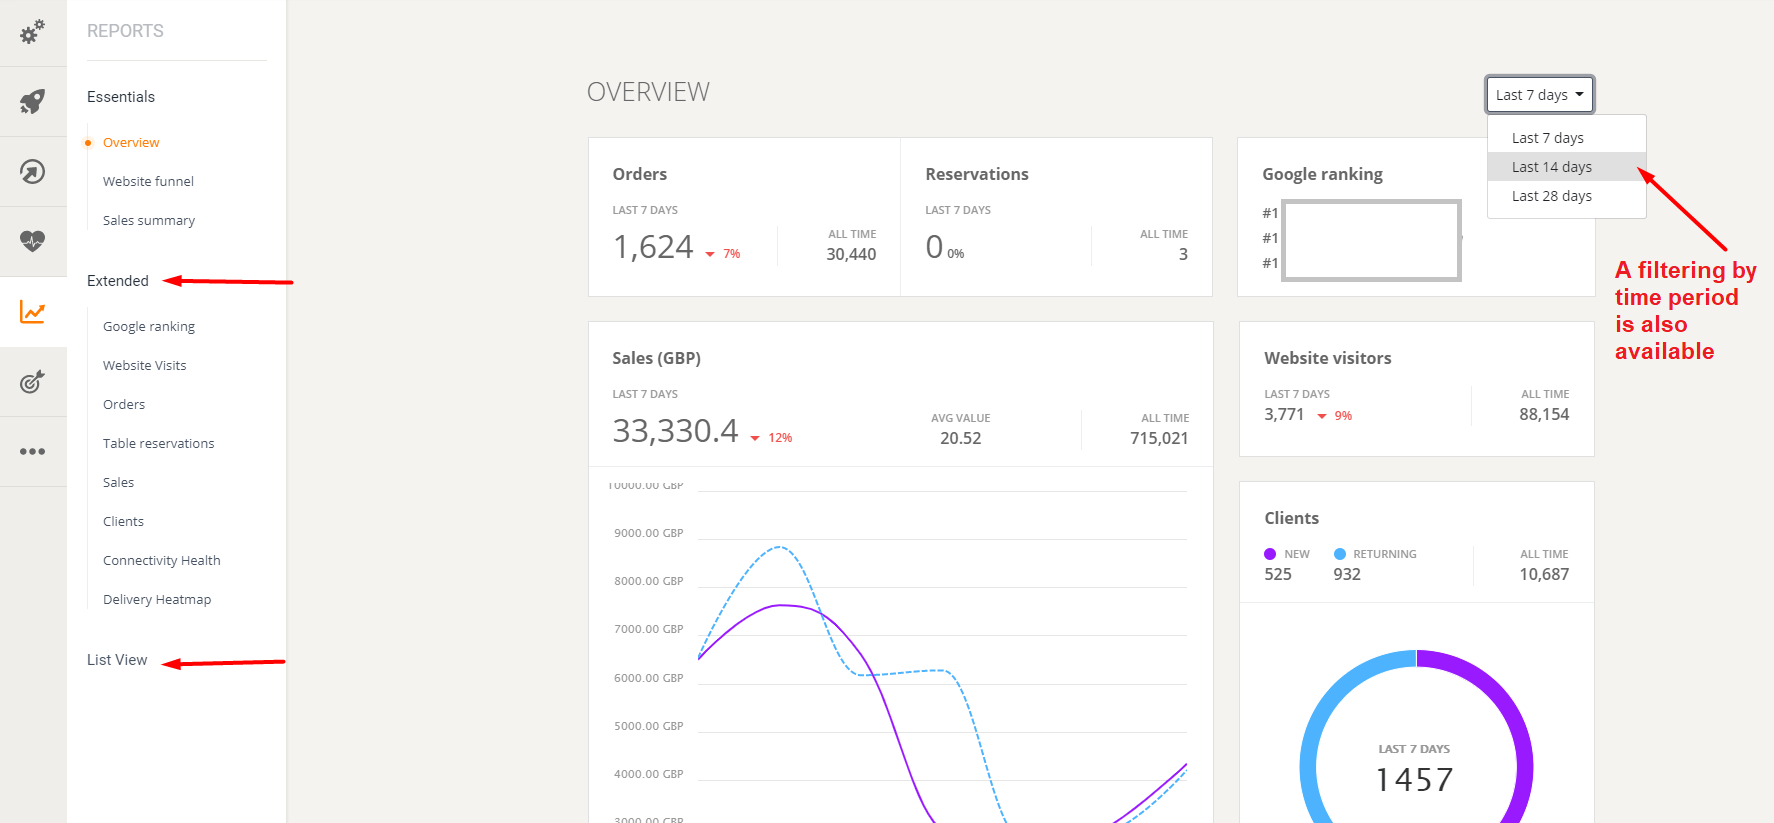
In the "Overview" section, the restaurant receives an overview of the number of orders, table reservations (if this function is enabled), sales, Google ranking, website visitors, and the number of customers dining in. You can filter the data by time period in the upper right corner.
Below the overview, you'll find several suggestions from the system for increasing online sales. Clicking on each one will display some sales tips.
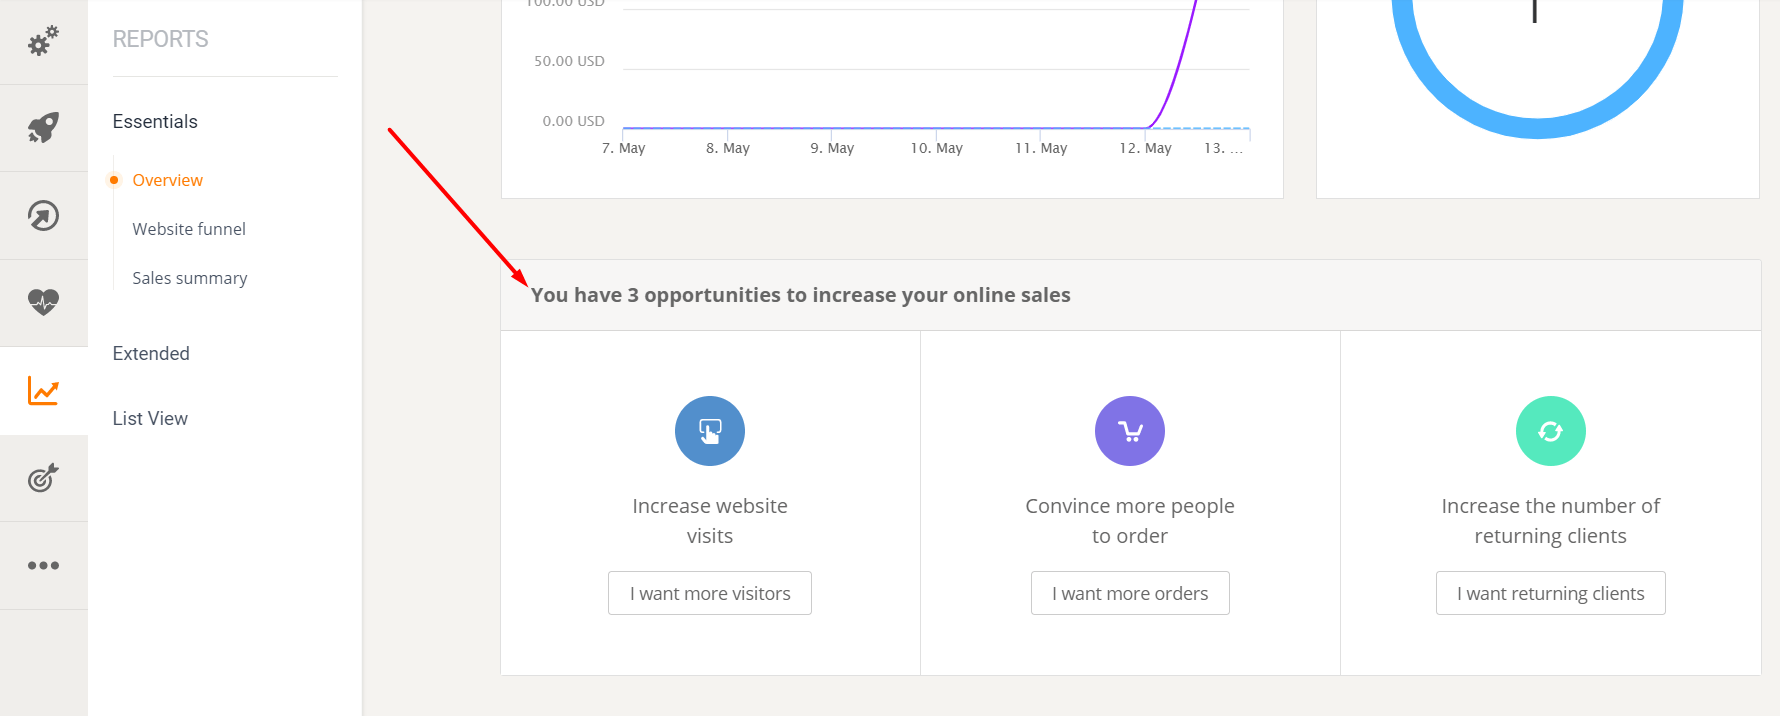
It is worth mentioning that each of the sections in "Overview" is displayed with more details in the "Advanced" and "List" sections.
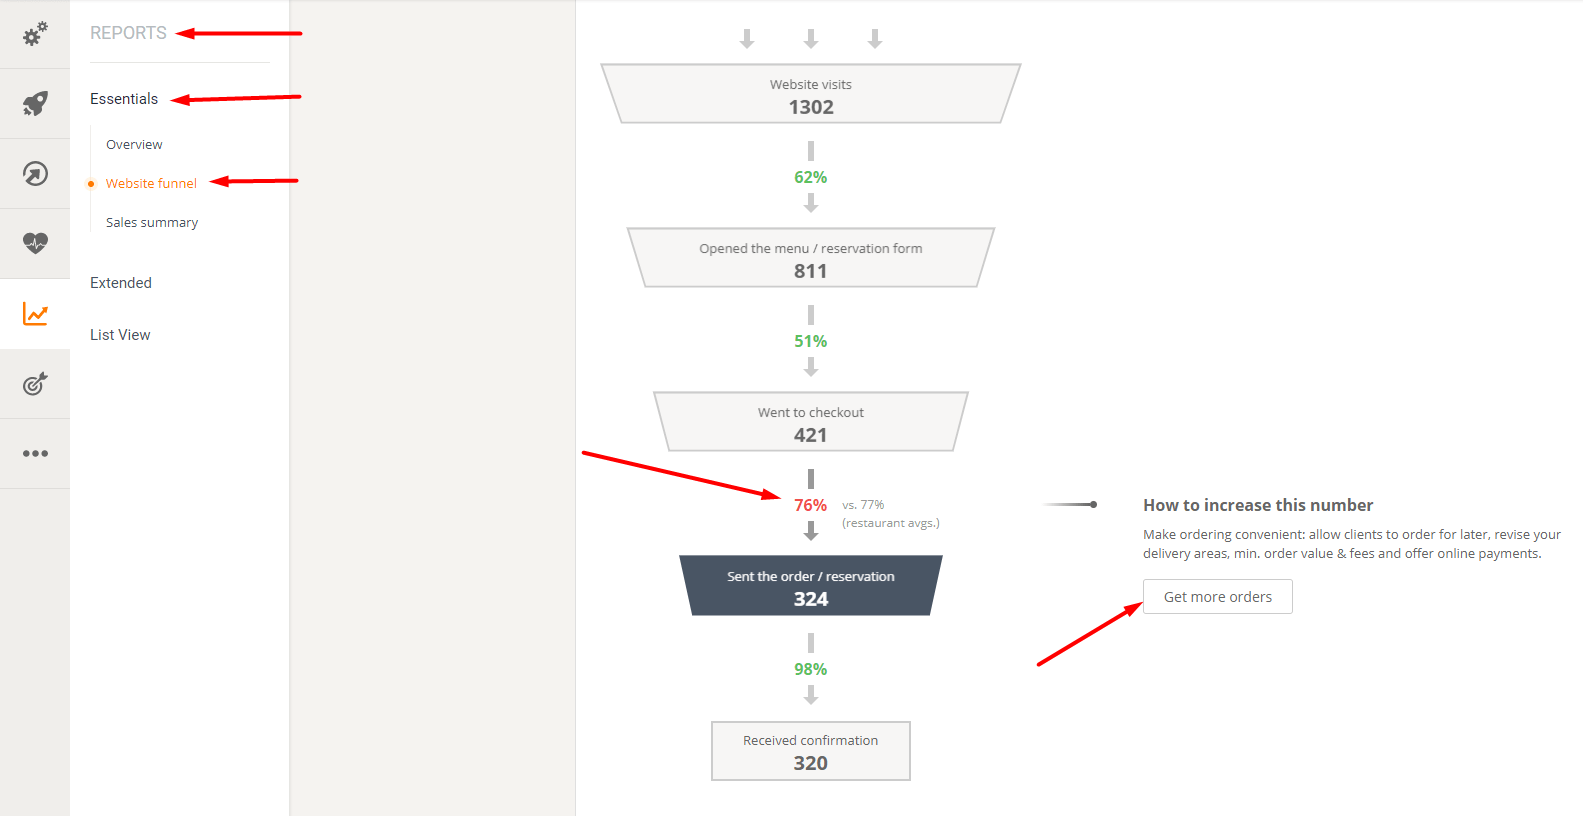
Let's start with the "website funnel".
Website funnel
The funnel shows the journey of website visitors from the moment they visit the site until they receive order confirmation. Here, the restaurant can see how many website visitors became customers and how many got lost along the way. Not only that, but also where they got lost, at which step.
Hover your mouse over each section of the funnel and on the right you can see whether the restaurant has nothing left to improve or whether there are additional things it can do to turn more visitors into customers.
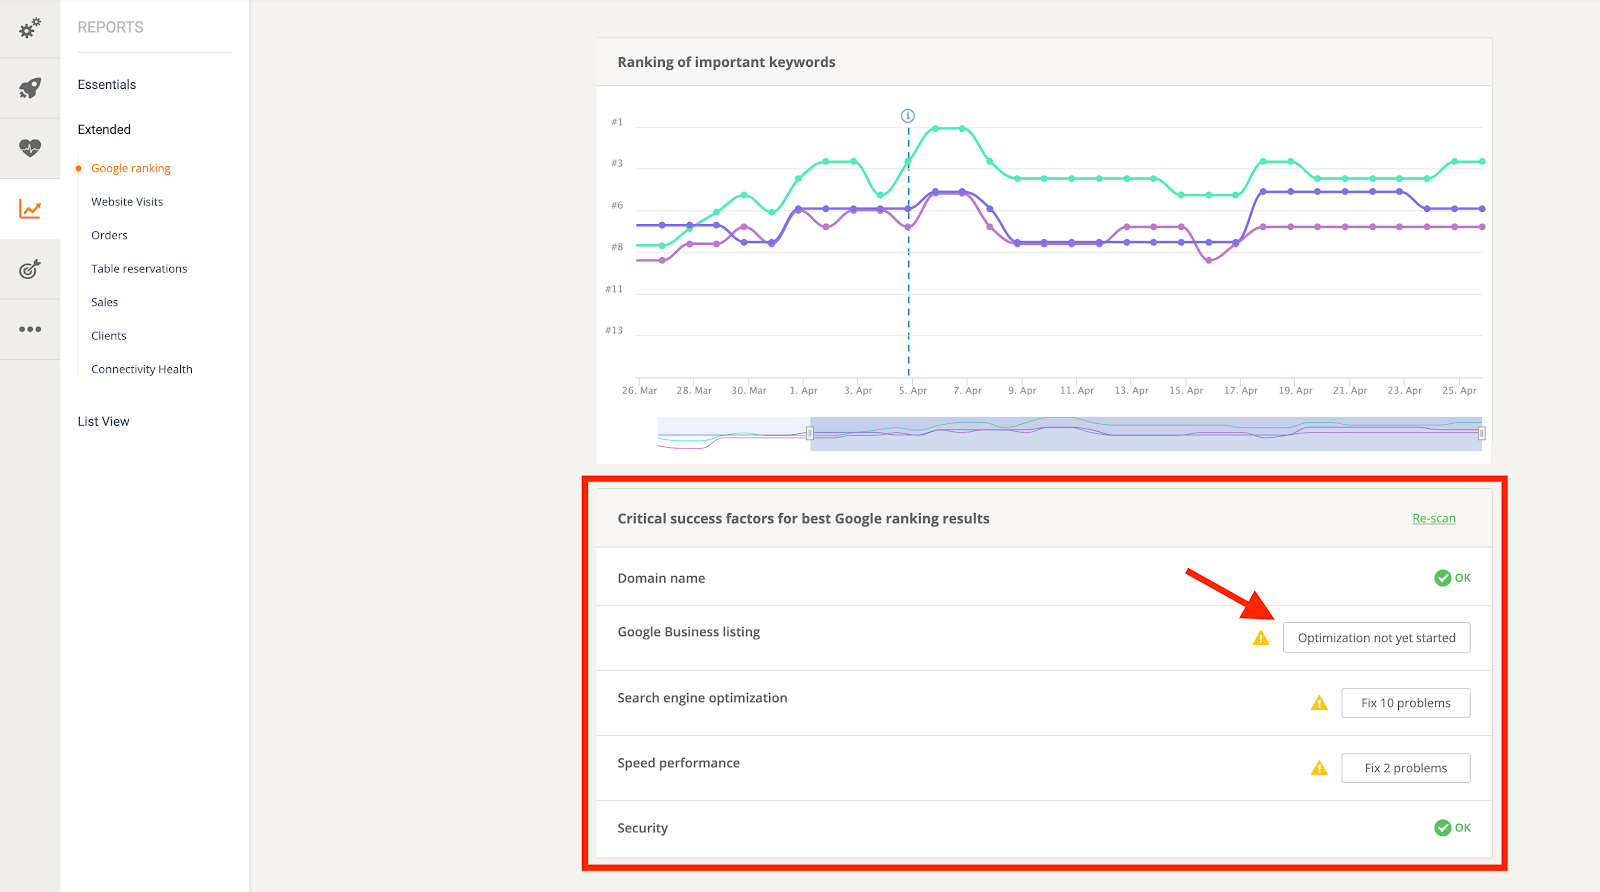
Extended
Google-Ranking
Switching to "Advanced" allows the restaurant to check its Google ranking for important keywords it is targeting. Here, the system provides a list of critical success factors that contribute to Google ranking.
If all the indicators show the green "OK" sign, then the restaurant is doing great. If not, click on the ones that aren't working as they should to learn how to fix the problem. The same applies to all the recommendations offered at the end of each report type in this section.
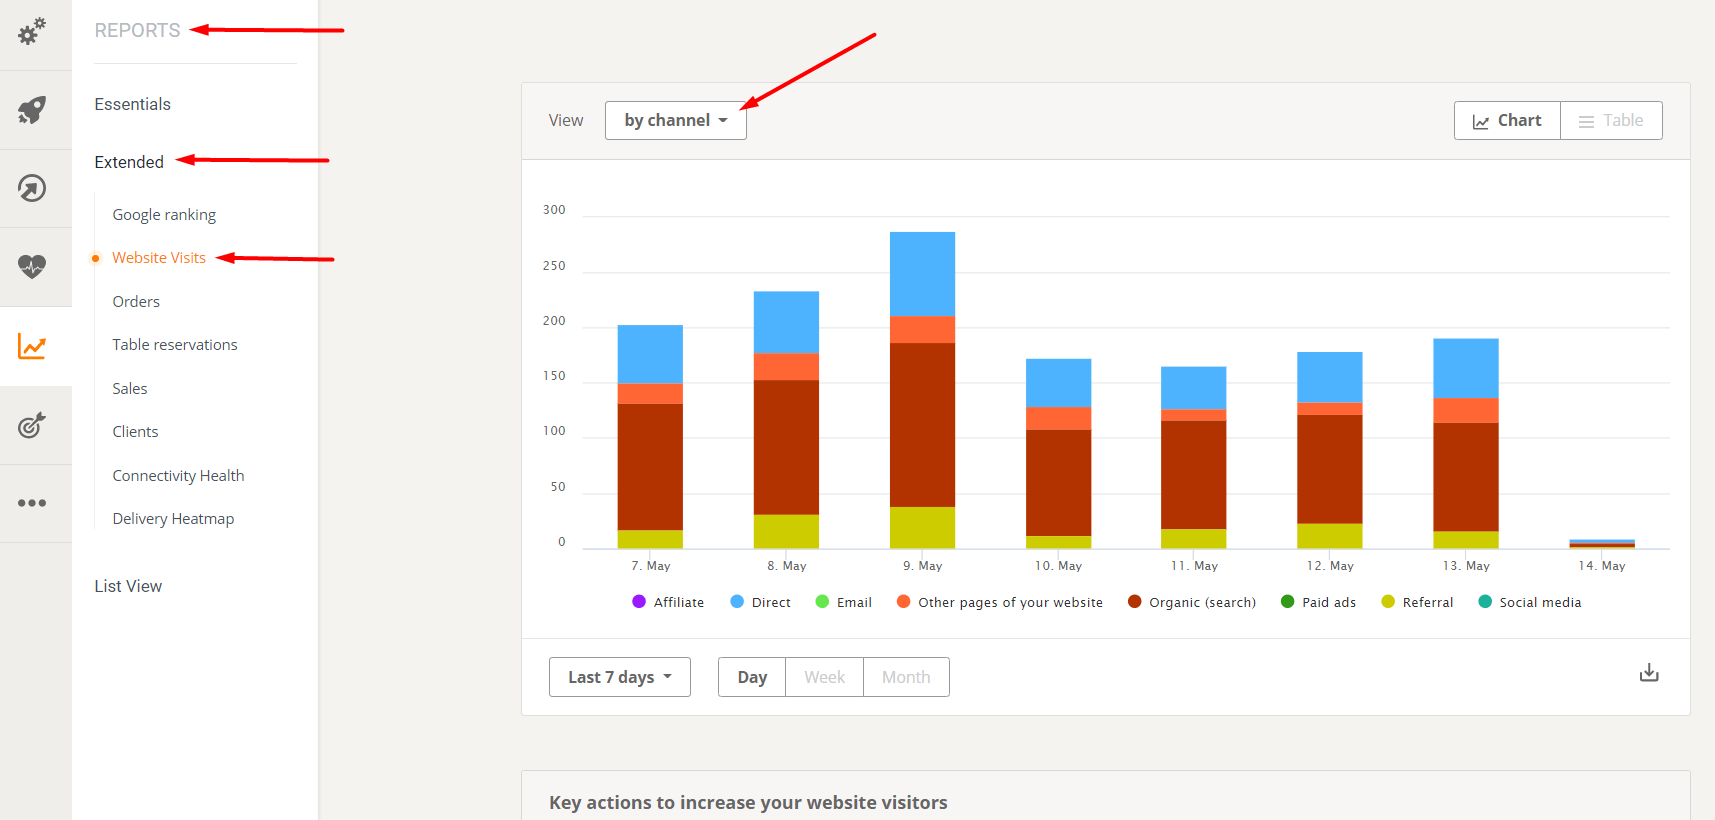
Website visits
This is a detailed look at website visits, along with a list of tips the restaurant can implement. You can view all website visits or filter by channel, and you can also display the report as a chart or table.
orders
This report provides an overview of the restaurant's order performance. This can be filtered by various criteria – e.g., result, order type, payment method, etc. – and by the desired time period. The restaurant can also display the orders as a chart or a table.
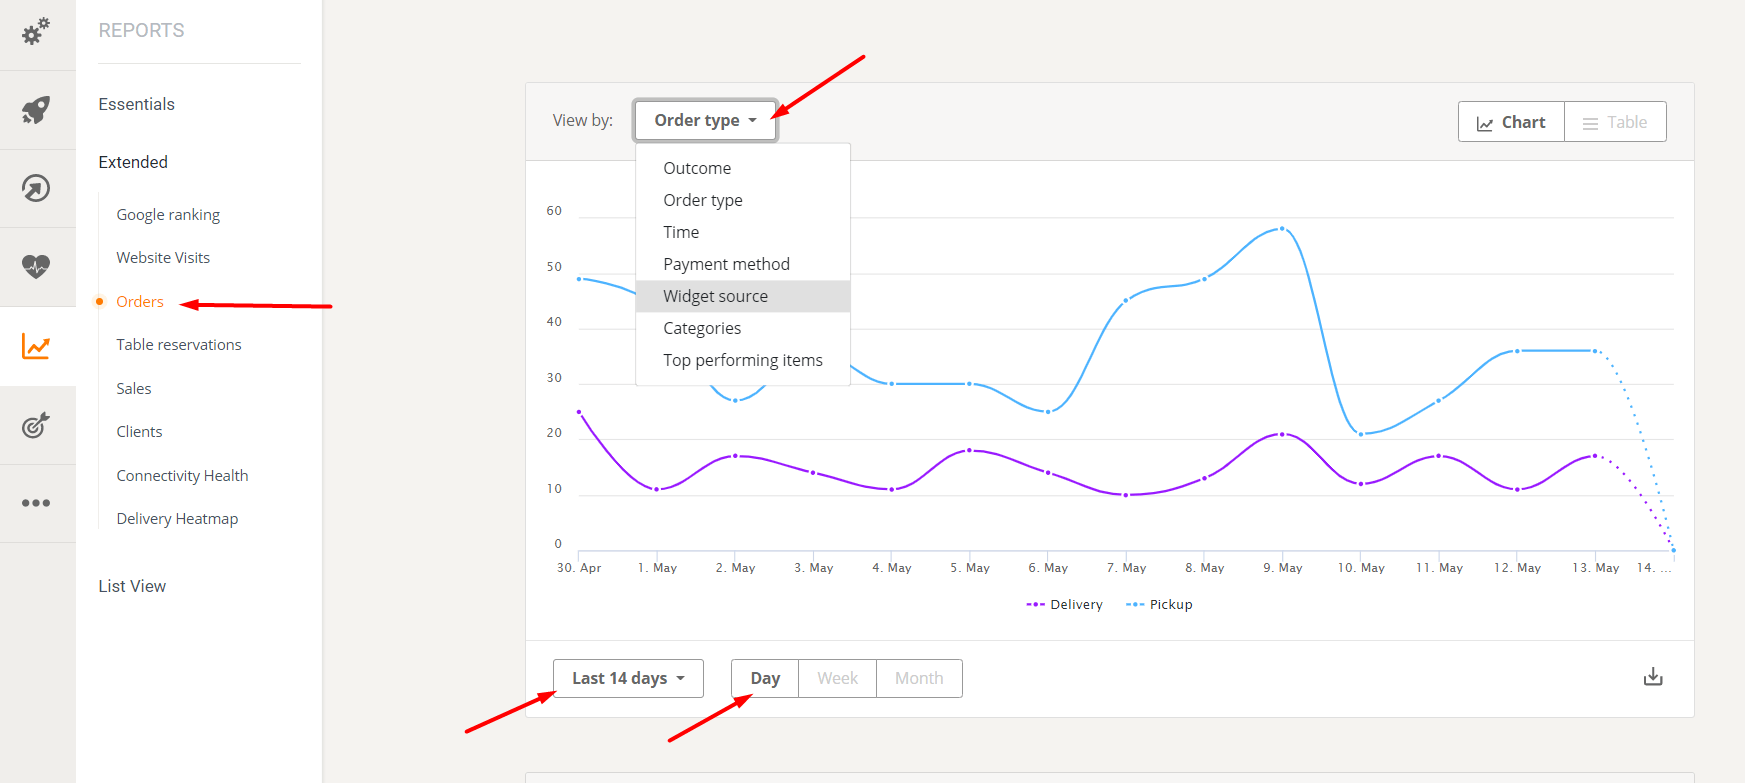
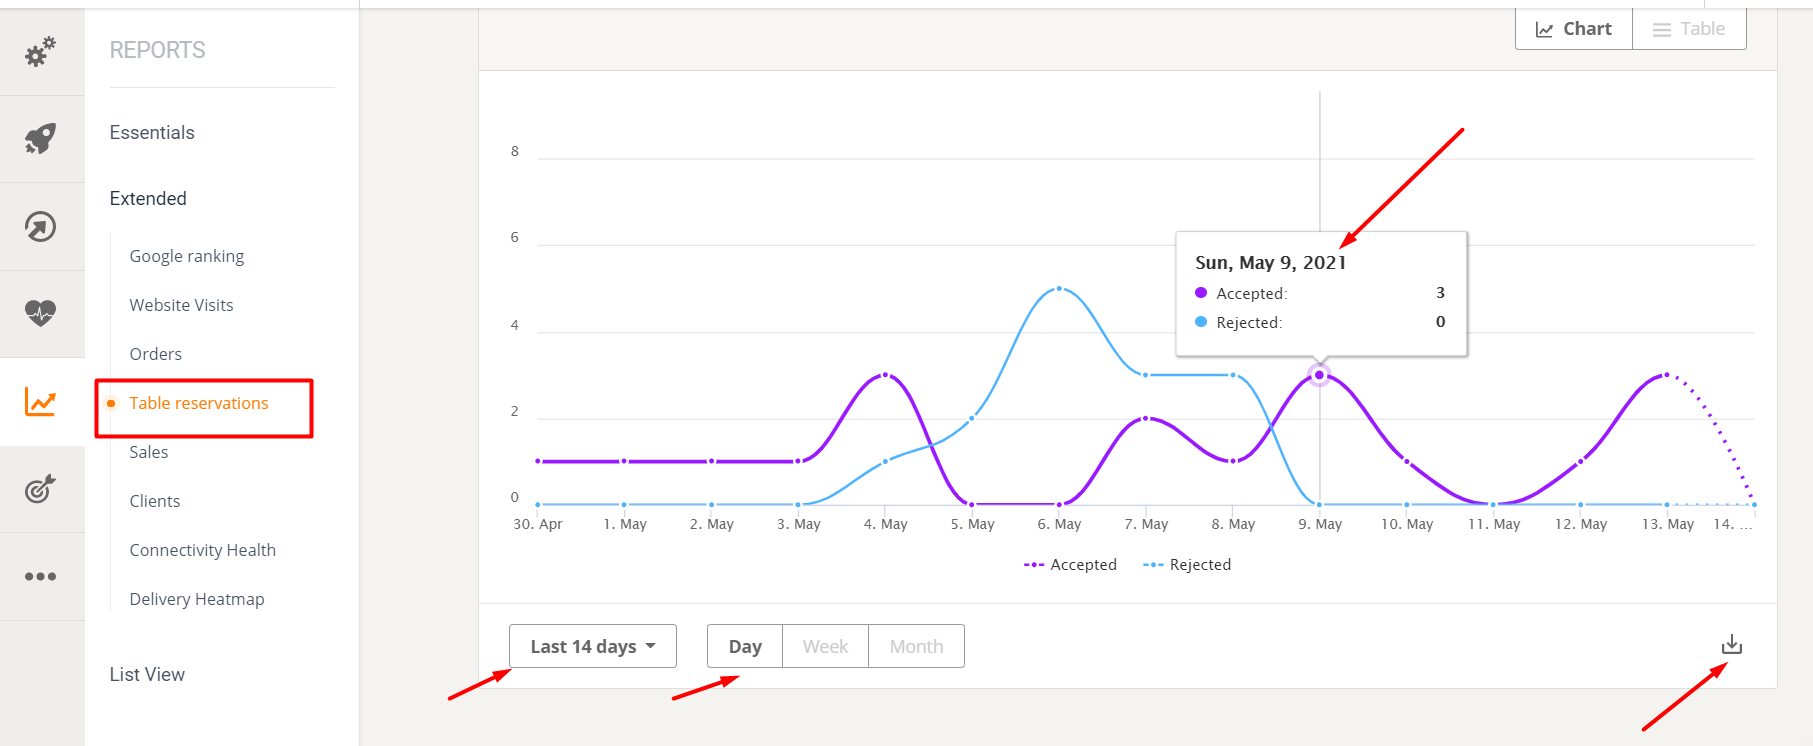
Table reservations
Under "Table Reservations," the restaurant sees a table showing the performance of table reservations over time, depending on the selected period. You can also export the report as a PNG, PDF, or CSV file.
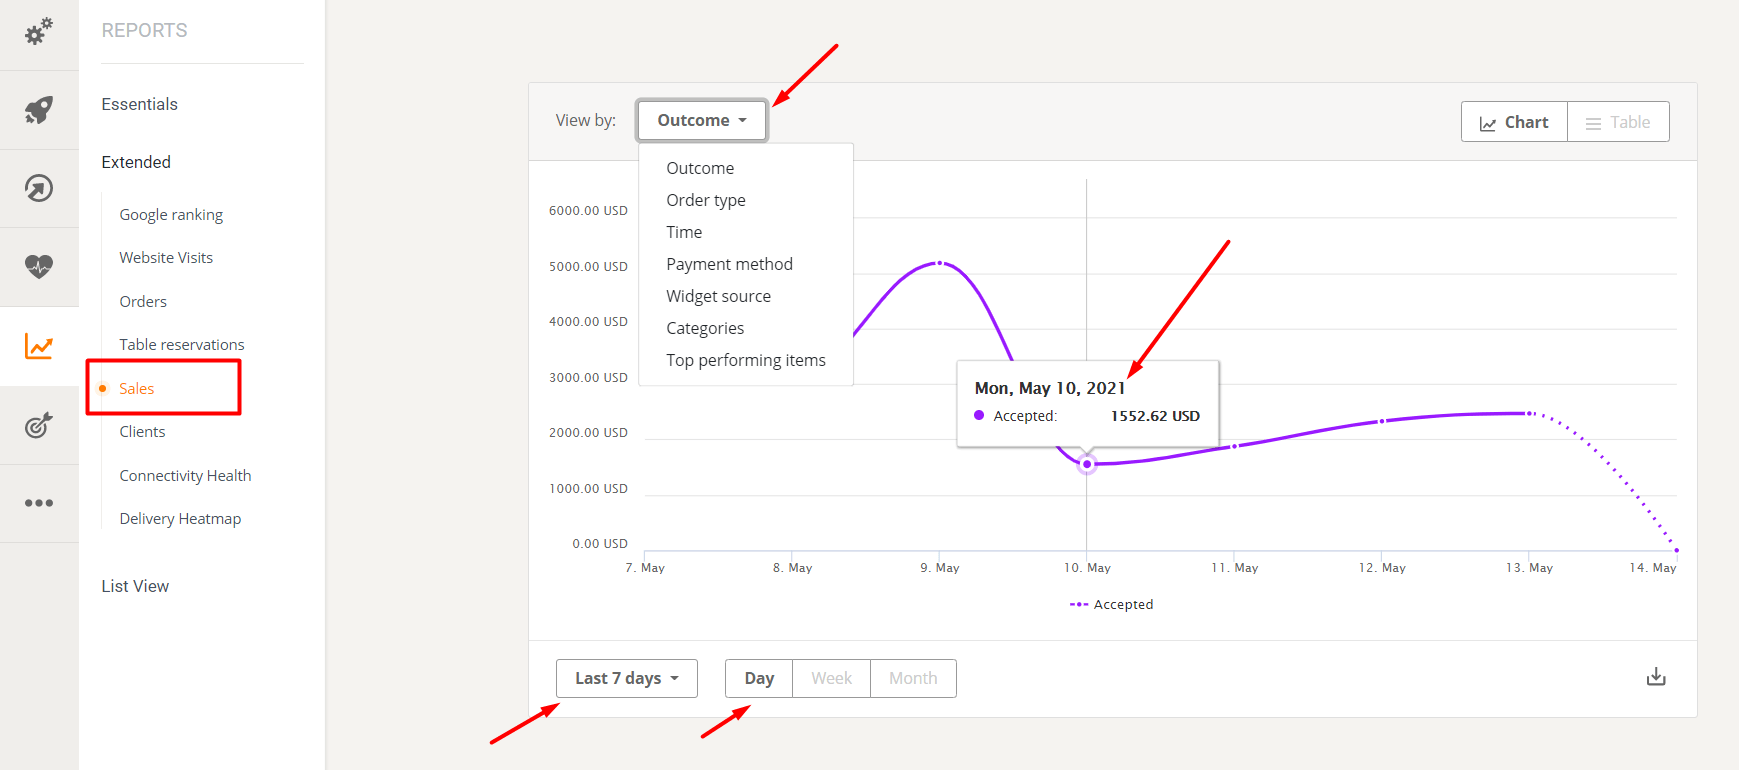
The revenue
On the page labeled "Sales", the restaurant can learn more about its sales and filter them by result, order type, time, payment method, widget source, categories and top-performing items.
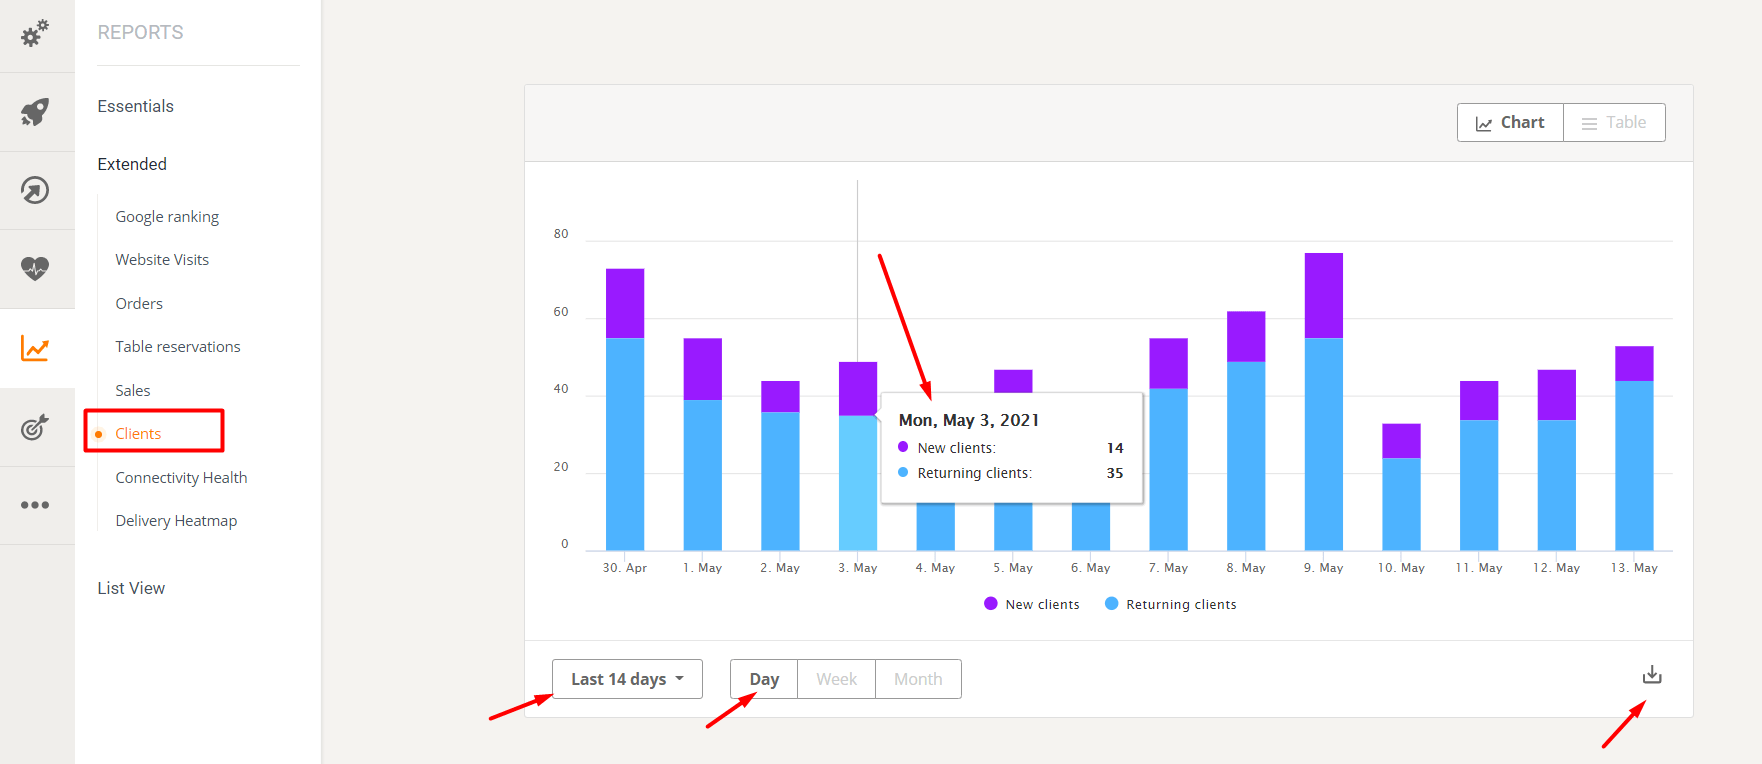
Customers
The next section deals with customers and shows the number of new and returning customers in the period selected by the account holder. You can also export this report. To attract new customers and generate repeat business, it is recommended to offer promotional offers.
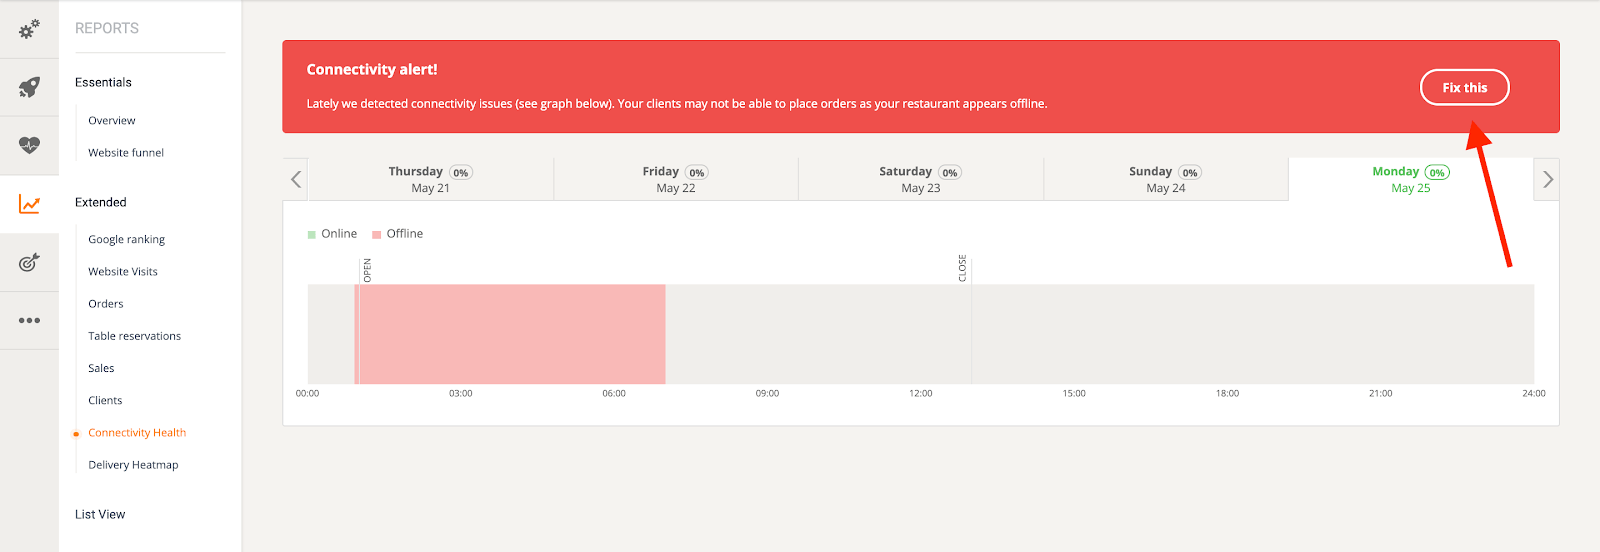
Connectivity integrity
Under "Connectivity Health," the account holder can check the connectivity health of the order-taking app (i.e., whether the order-taking app is connected). The score should be higher than 95% for it to be considered successful, allowing customers to place orders at any time during the restaurant's opening hours. Poor connectivity results in missed orders.
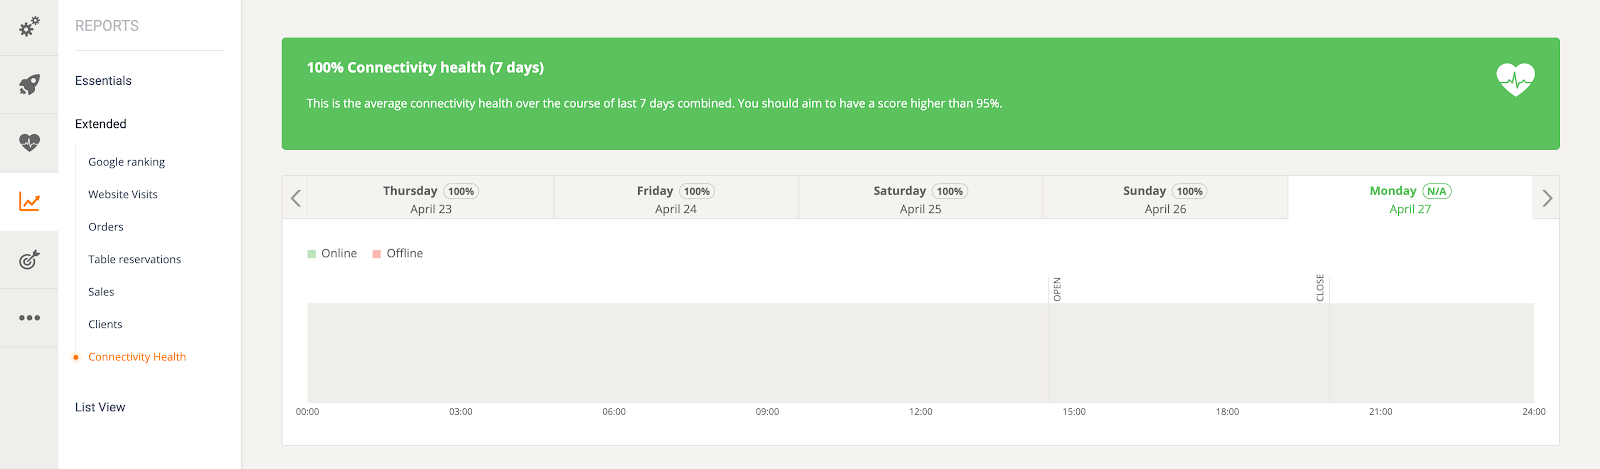
If there are connection problems, a connection warning will be displayed. Click the "Fix Problem" button for more information on how to avoid this.
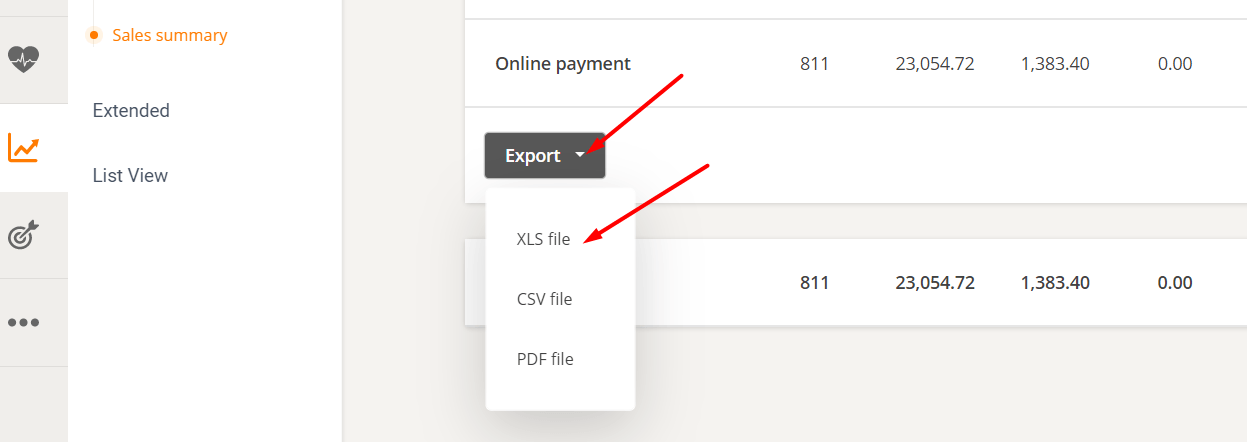
Sales summary
Restaurants can now evaluate their order volume using the Sales Summary tool.
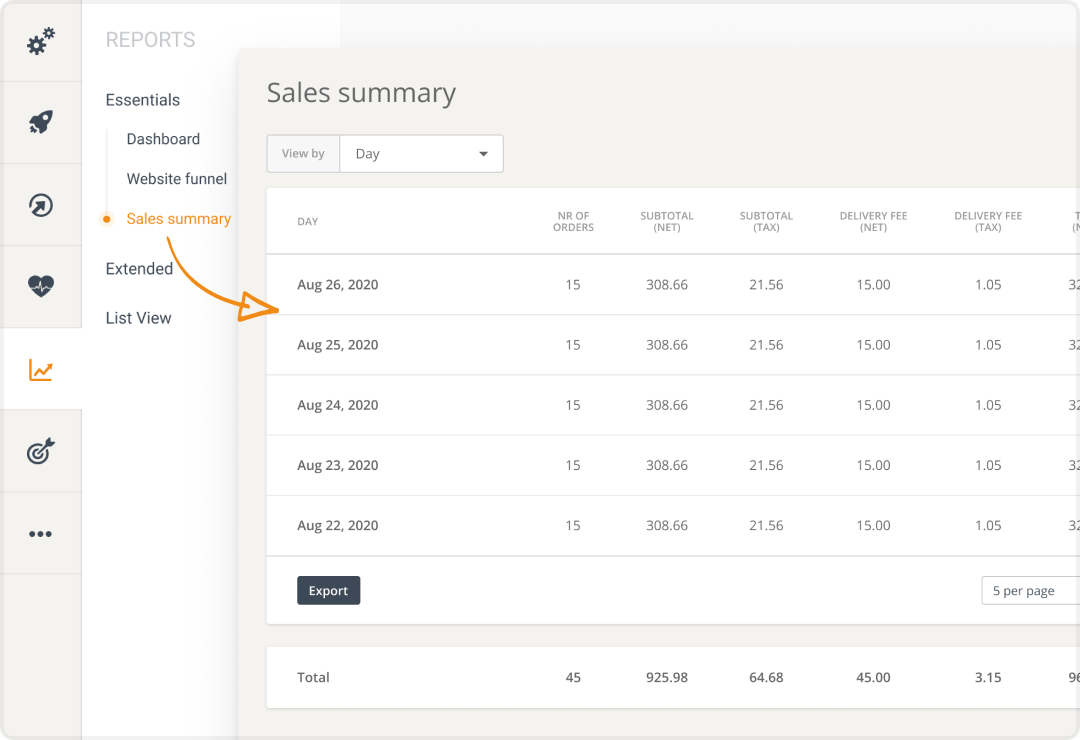
Simply go to the Reports section, filter the sales summary by day, week, month, payment method or order type, and then select the desired time period.
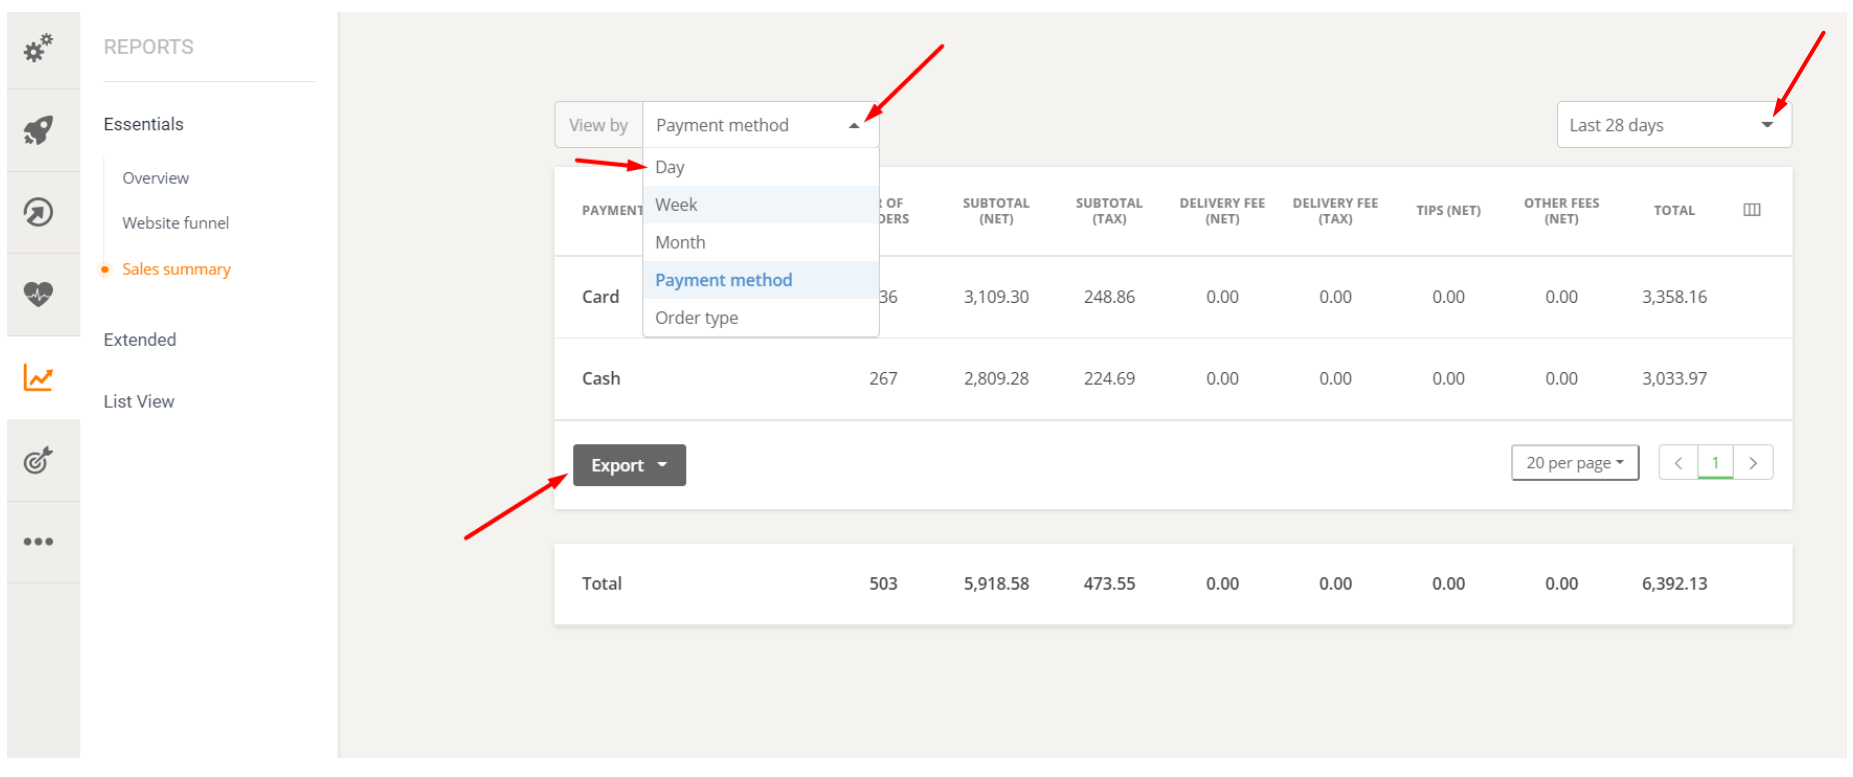
You can also export it to the format of your choice to obtain a sales report for your restaurant.
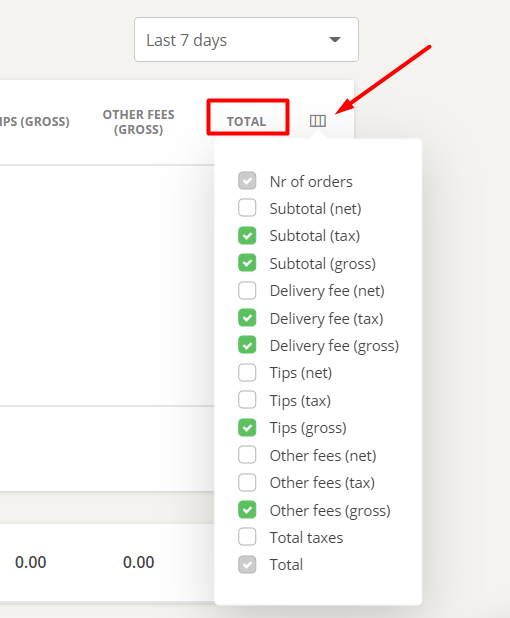
Restaurants can also use the "Custom Column" button next to "Total" to display additional information they may need.
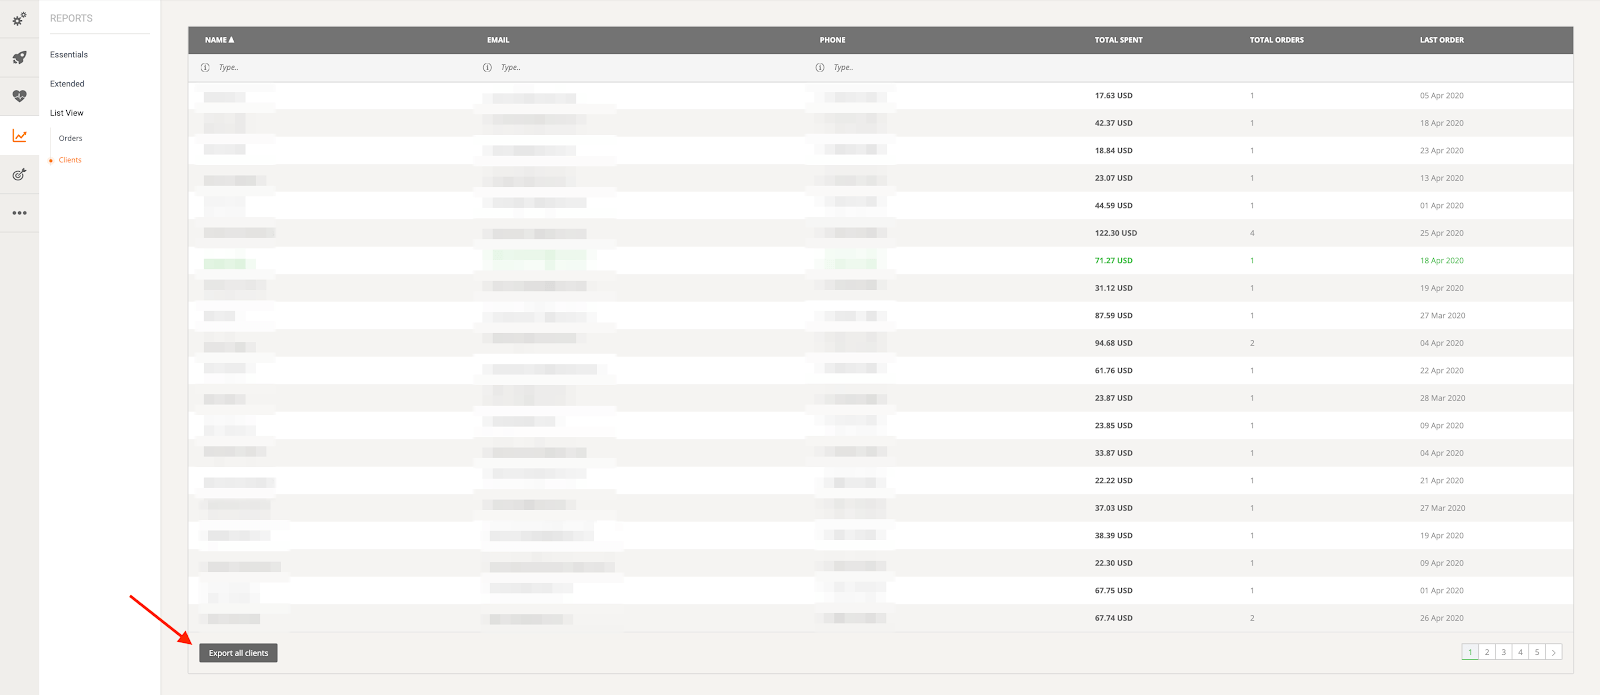
List view
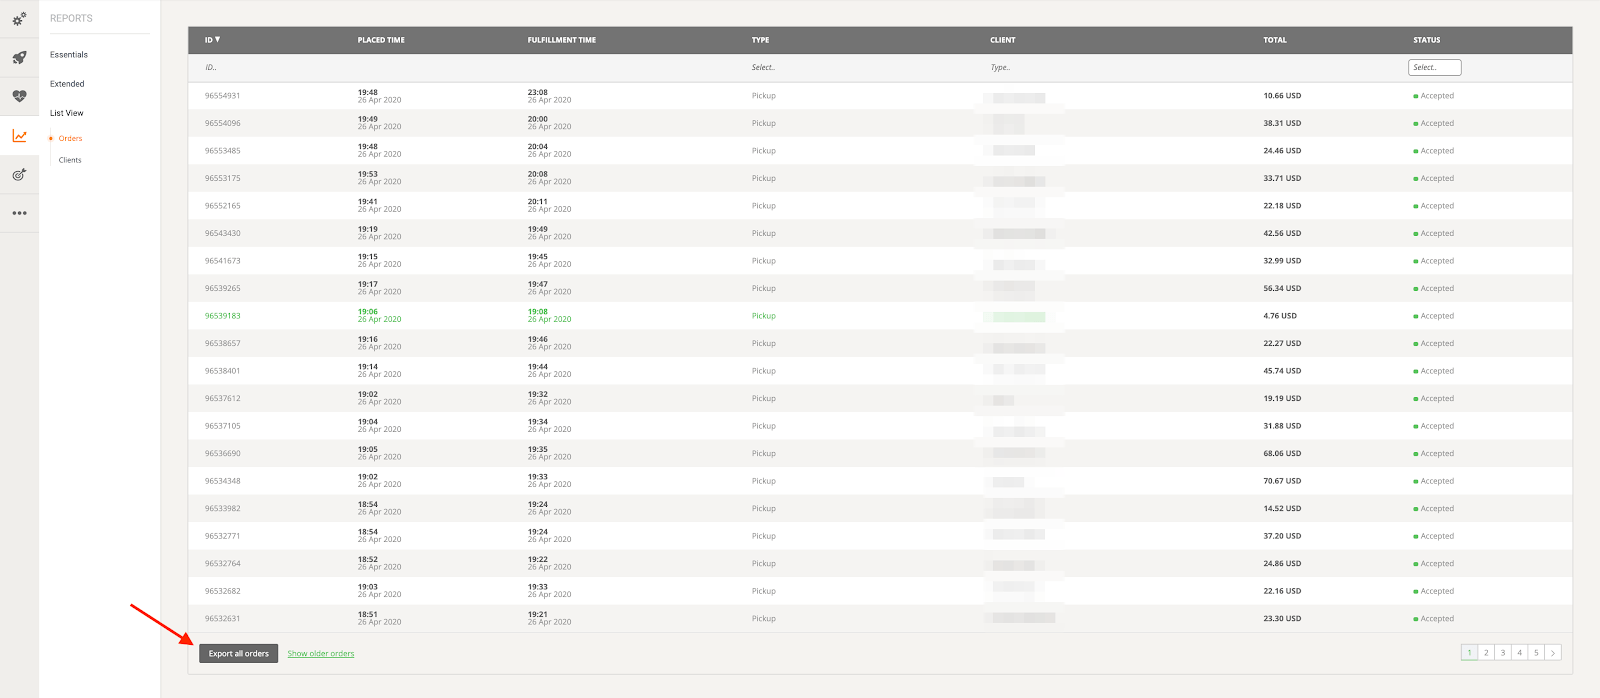
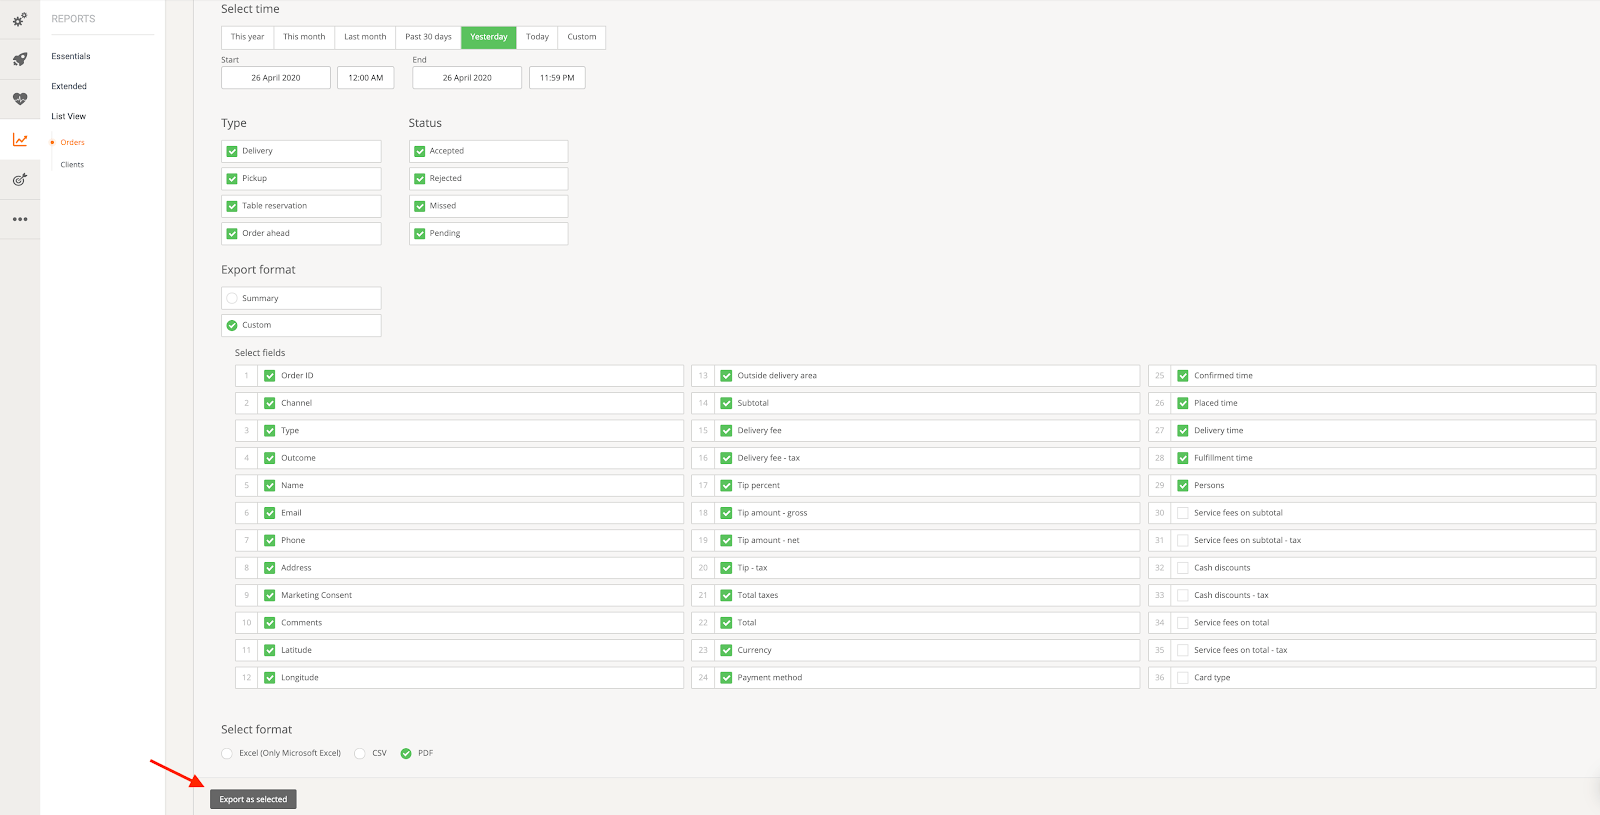
Finally, under "List View," the restaurant can see a list of all orders and customers. For orders, they can click "Export All Orders" to access a page where they can filter by time, type, status, and a variety of custom fields. Tips, for example, can also be included in the export, as long as the tip boxes are left enabled.
The last report type the restaurant can export is "Customer," which displays a list of all customers with their name, email address, phone number, total spending, total orders, and time of their last order. This report can also be exported, and the export includes the customer's marketing preferences.